
If you're familiar with the fantastic open data portal for Pennsylvania (PASDA); we now have the ability to display most of the data found there...directly in CSDatum! But it's not just limited to PASDA information, we can display almost any WMS layer that has been published online.
What's WMS, you might ask? I'm firmly entrenched in the anti-acronym camp (AAC), but I support this one. A Web Map Service (WMS) is a widely supported format for mapping and GIS data. Which means it's a very easy way for PennDOT to share their traffic count information - or PA DEP to provide impaired stream data...and display it alongside your own stormwater mapping in CSDatum. The WMS standard has been around for a long time - but for various reasons, we decided to update our service to include it.
Here's how it works.
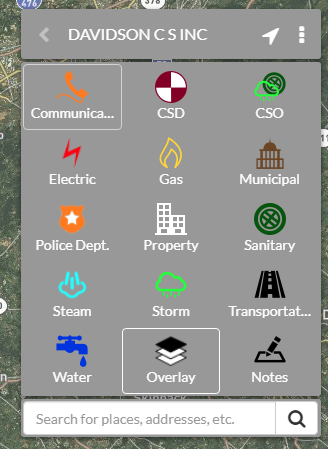
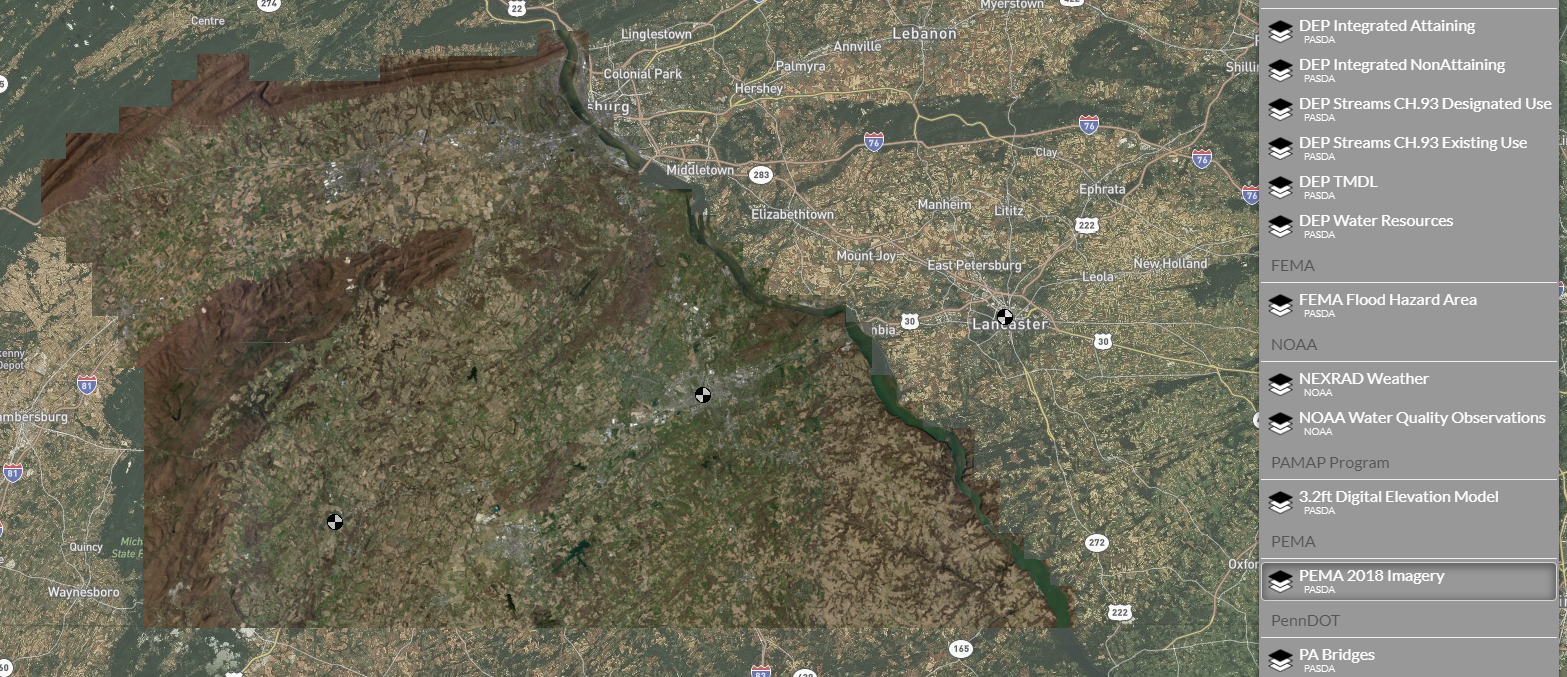
Click on the familiar 'Overlay' icon on your map legend - which up until now, housed your static GIS files (think of parcel & zoning maps - manually clipped down and uploaded into our program).
Once it expands - you will see a new option list, very similar to this.
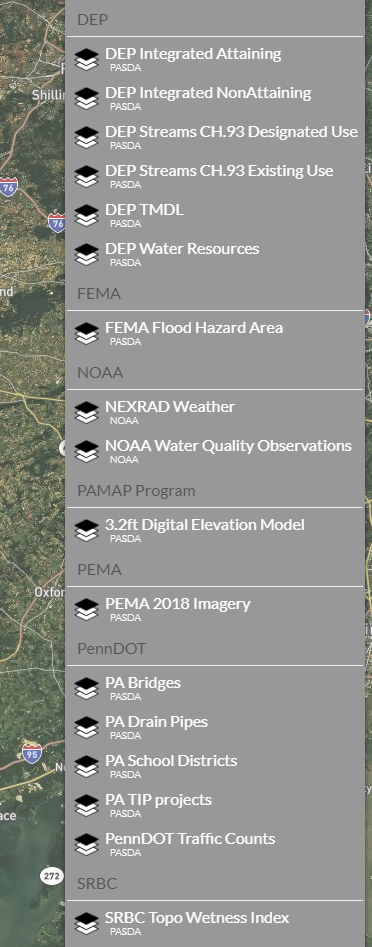
Click on any one of the new layers - and wait for it to load. In this example, I turned on DEP's Integrated Attaining layer.
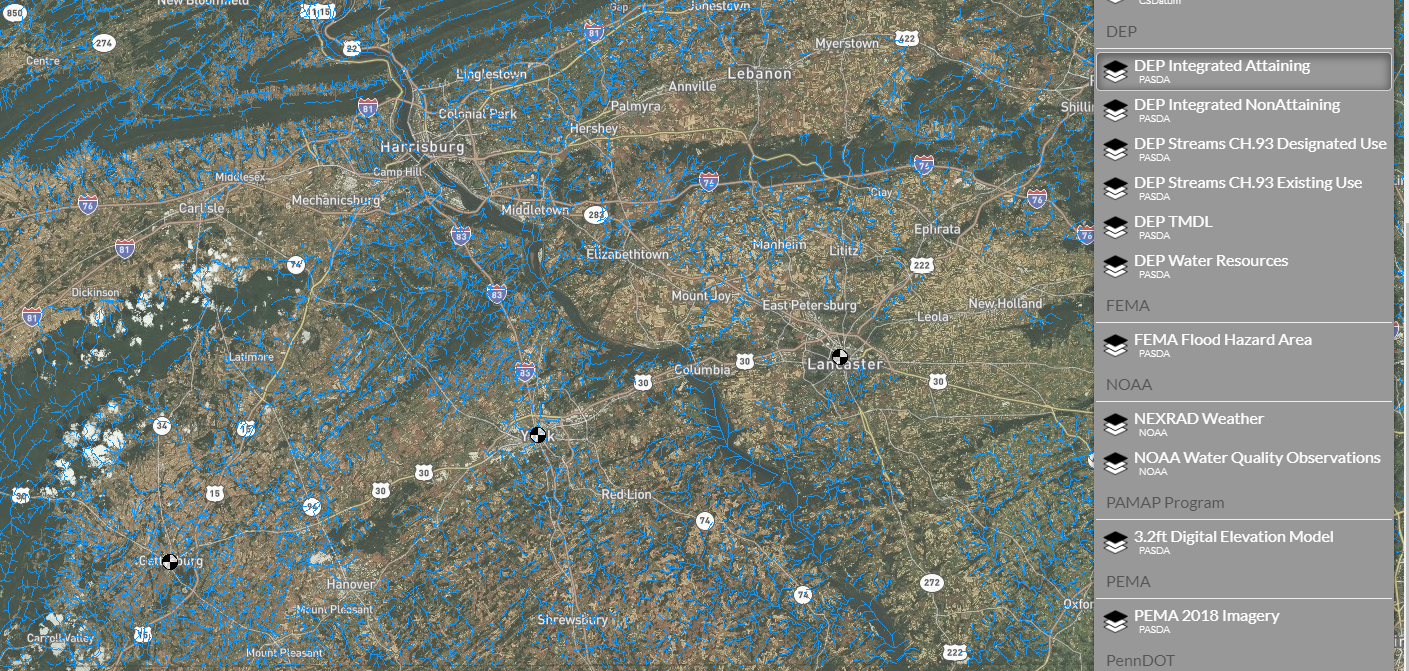
This will turn on the mapping for the entire state - and the layer is updated and maintained by DEP as they make changes. No more manual clipping and uploading! If you click or tap on a stream segment - you will see whatever information they've stored with that point or line.
Please note - we cannot control the 'style' of the mapping; meaning the color, symbols and thickness are dictated by others. We simply pass them through, as-is.
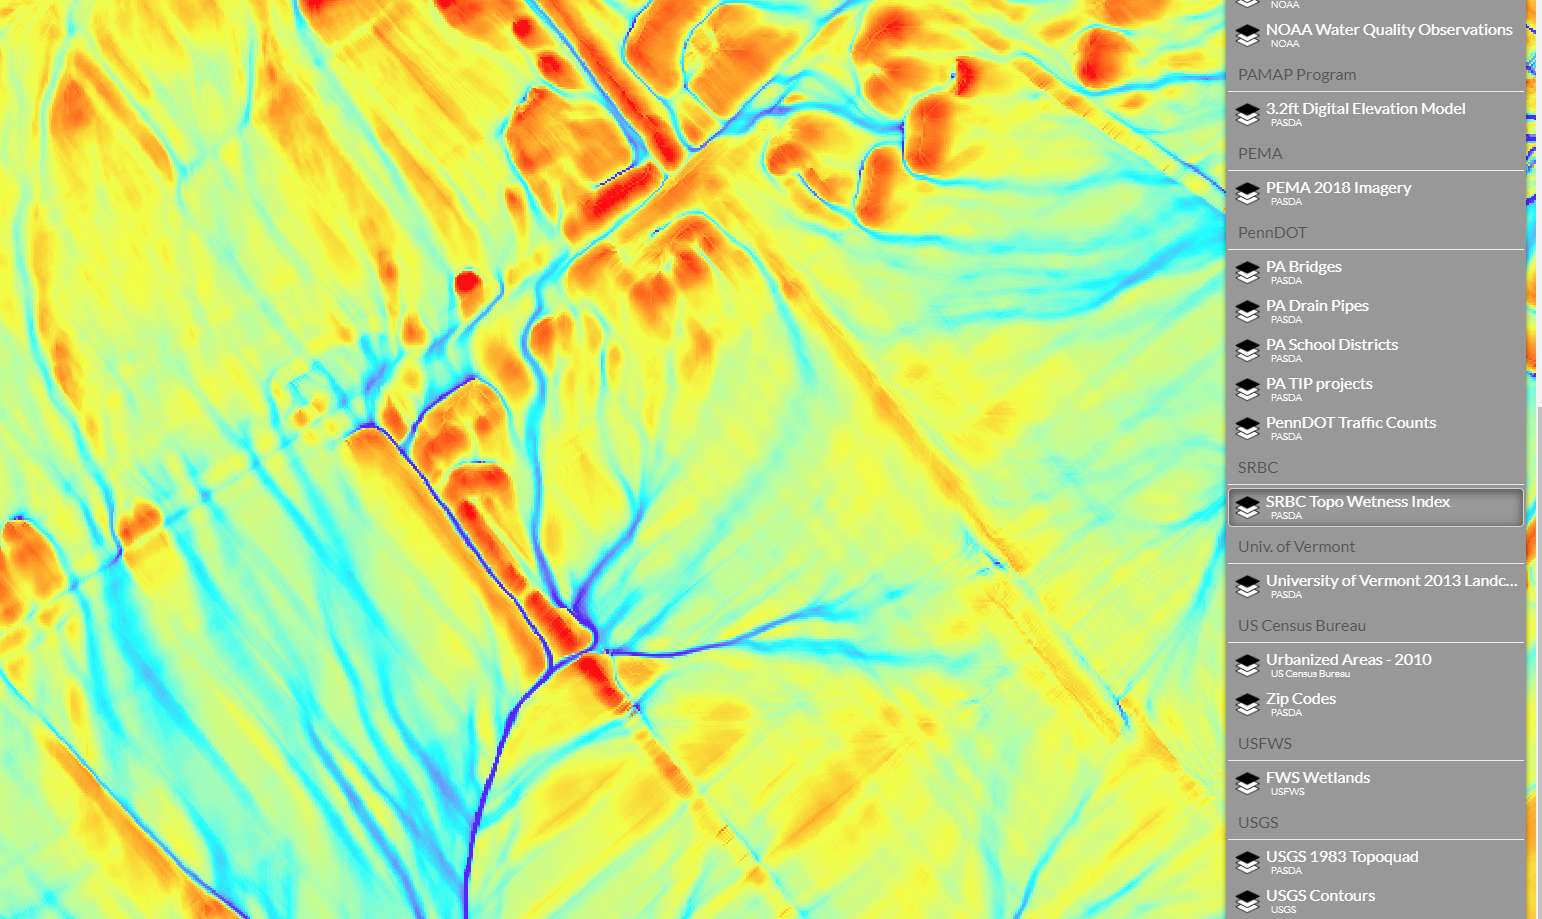
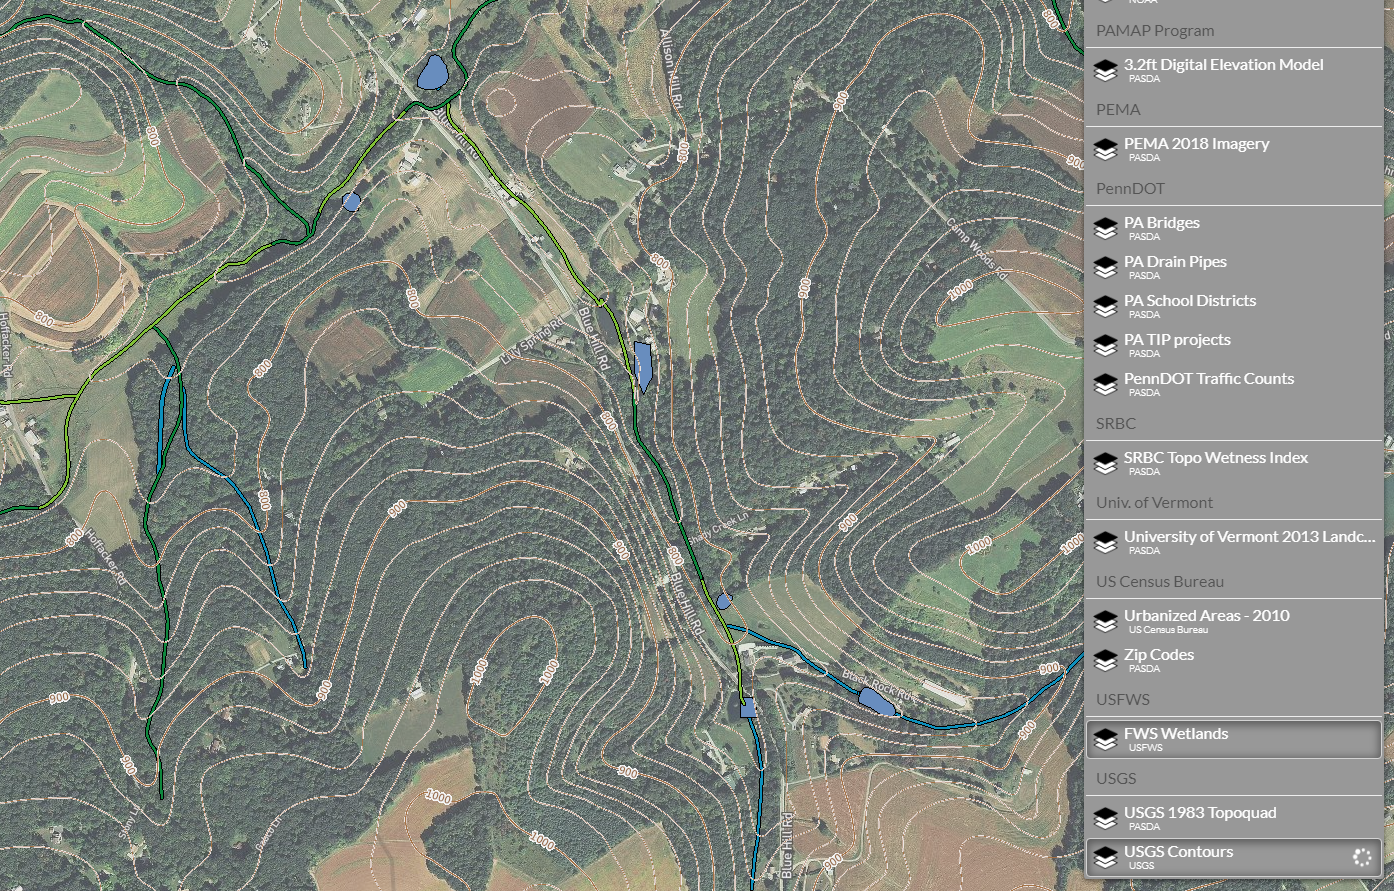
Here's another interesting example, SRBC's Topo Wetness Index. Several of you had requested this overlay this summer - and here it is!
We can also display PEMA's 2018 aerial imagery - which is currently available for Adams, Cumberland and York Counties.
This is significant - because when many of you zoomed in, you were blasted with clouds or blurred imagery from our vendor Mapbox. No more!
For example, check out this street in SW York County.
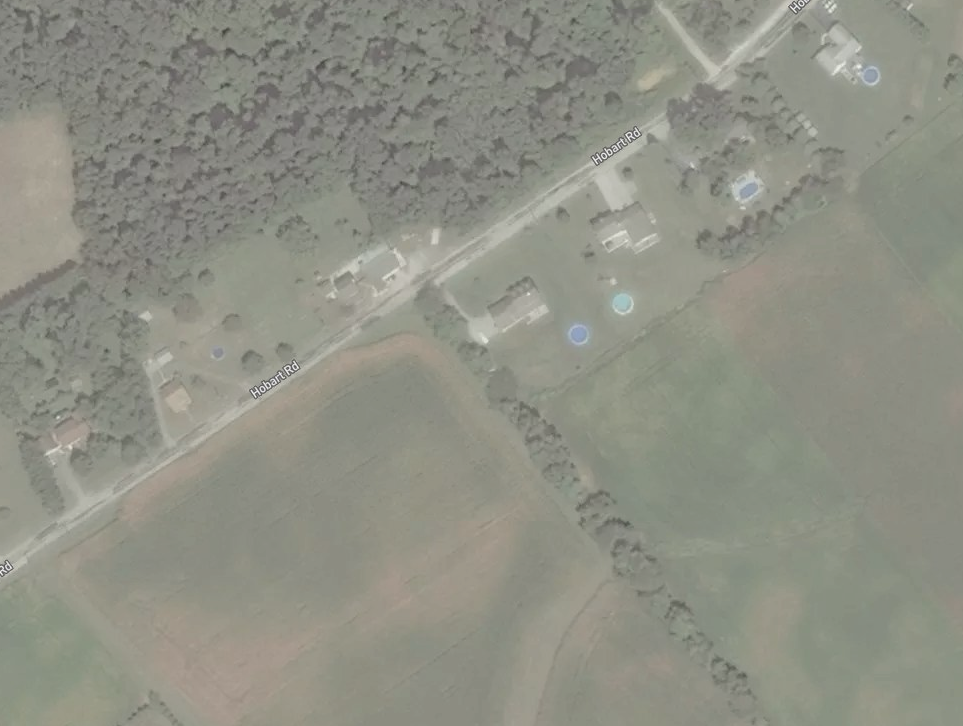
But toggle on the PEMA 2018 layer.....and see the difference in clarity.
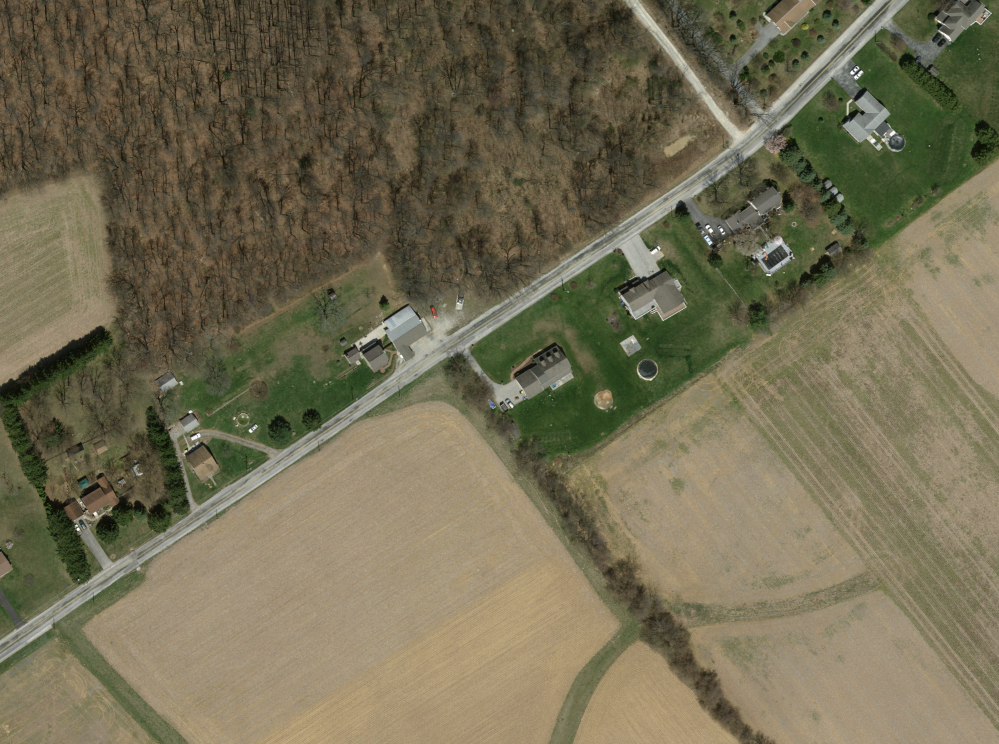
This imagery will NOT contain any road labels - but it's obviously a significant improvement. As PEMA continues to fly & photograph the rest of PA, we will make it available in CSDatum. You can read more about their progress here.
You can also toggle on several layers at once - for example, here's the Fish & Wildlife Service Wetlands map over the USGS Contour Mapping and our Mapbox imagery.
Here's the full list of WMS layers in CSDatum
NWQMC Water Quality Sites - Streams
PennDOT Traffic Counts
PennDOT State Roads
PennDOT Local Roads
PennDOT Counties
PennDOT Engineering Districts
PennDOT Municipalities
PennDOT School Districts
PennDOT Bridges
PennDOT Rail Lines
PennDOT Drain Pipes
PennDOT TIP projects
DEP TMDL
DEP Streams CH.93 Existing Use
DEP Integrated NonAttaining
DEP Integrated Attaining
DEP Water Resources
DEP Streams CH.93 Designated Use
FEMA Flood Hazard Area
PAMAP Program 3.2ft Digital Elevation Model
SRBC Topo Wetness Index
PEMA Imagery - 2018
Univ. of Vermont Landcover - 2013
USGS Topoquad - 1983
NOAA NEXRAD Weather
USFWS Wetlands
USGS Contours
US Census Bureau Zip Codes
US Census Bureau Urbanized Areas - 2010
NOAA Water Quality Observations
We can control availability at a client level - so if you'd like a layer removed from your account...or even better, if you know of another WMS layer you'd like added - please let us know.
And don't worry, all of your existing 'Overlays' are still there. If you'd like any of these removed or updated, again, send me an email and we'll get it taken care of!