
You can now view all the data you've meticulously entered on the map - but in table or list form! I've joked about this before...but think of a big, interactive spreadsheet for all of your stormwater BMPs, signs, building permits & more. Sort it, search it, print it - you get the idea...but from the convenience of your web browser. You might have already noticed a slight change to our menu screen - but if not, it's now arranged like so: 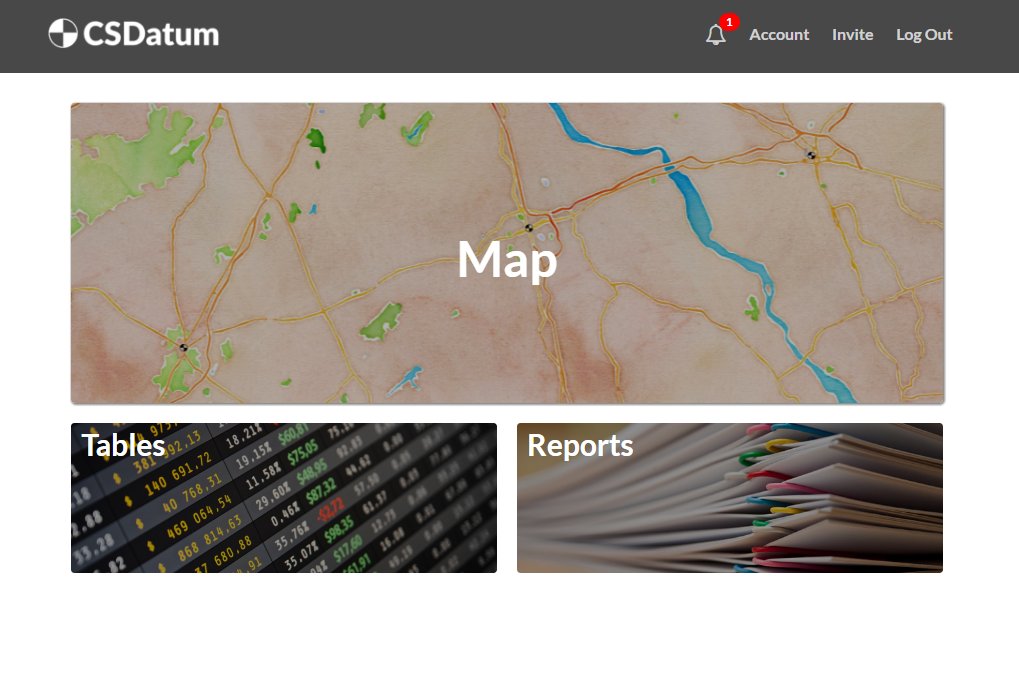
The big addition here is the 'Table' button - which will take you to a sub-menu screen that will look similar to this: 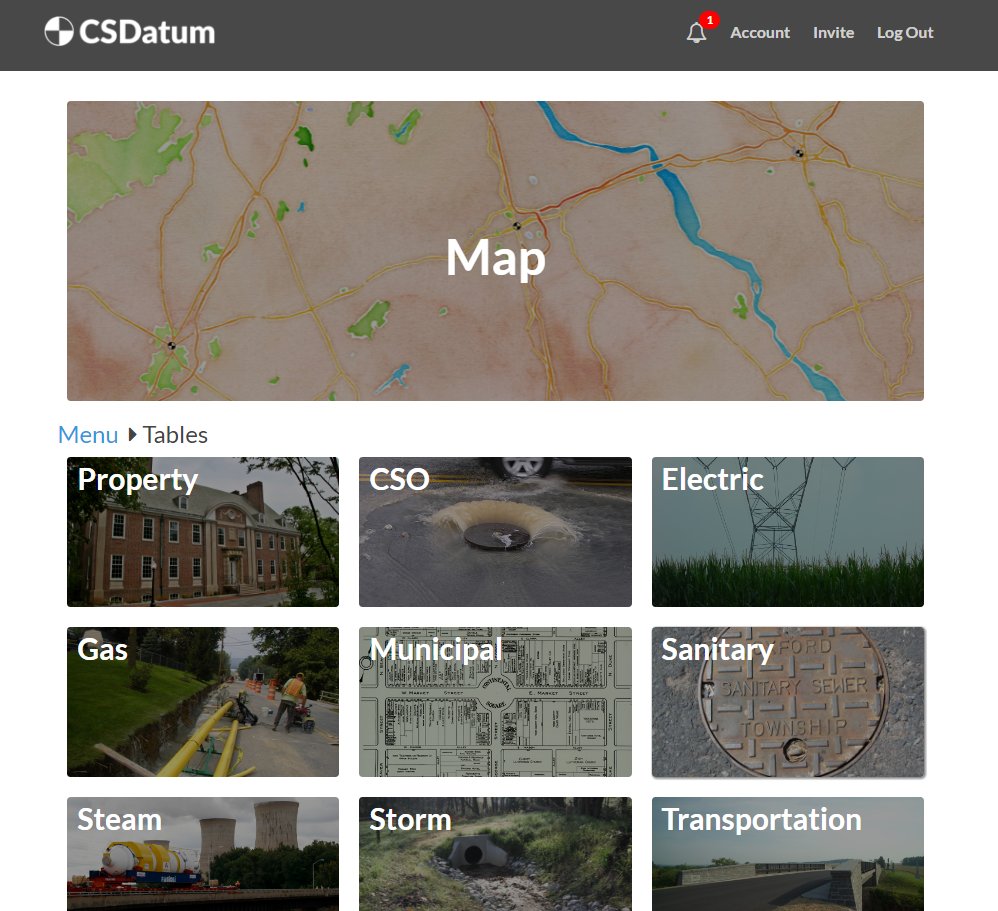
This hierarchy matches our organization system from the map - so simply click on your desired layer and view the expanded list of assets (stormwater shown below): 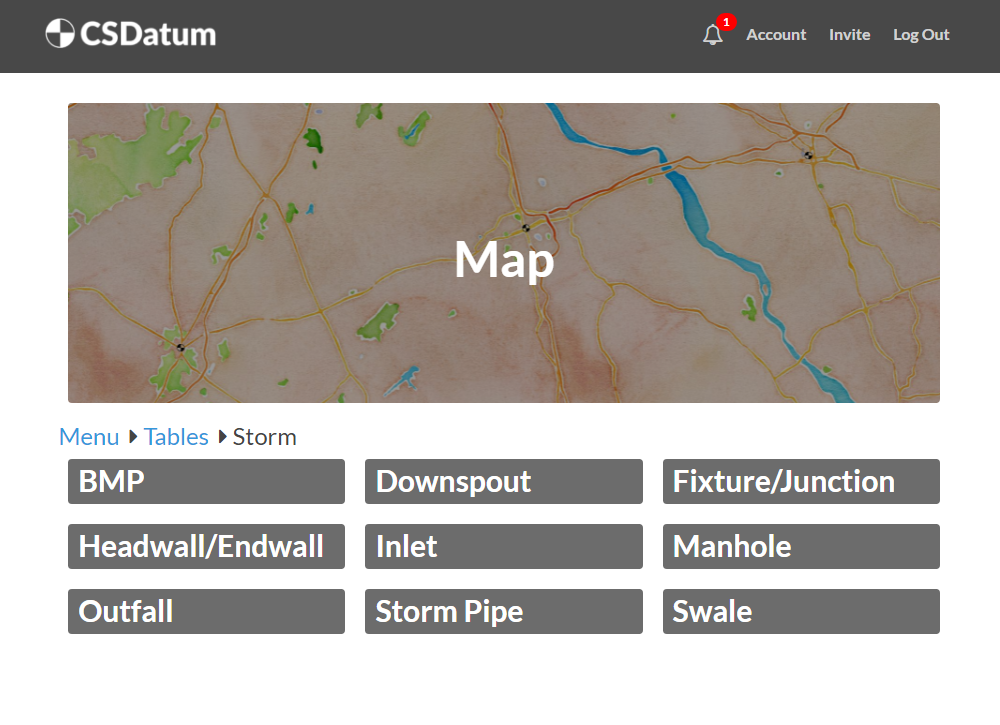
After that, it's pretty obvious. Click on the asset you're after - and be transported to a magical land of tabled data. From here you can search, sort, print, export (to Excel or CSV) and show/hide additional columns. 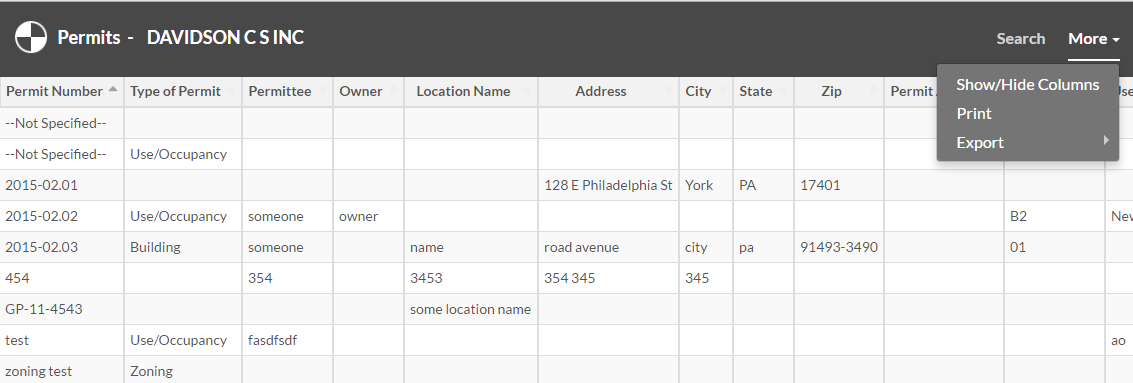
So yes, we've come full circle and built a simple spreadsheet interface for your data. Most engineers (all?) have an irrational love for spreadsheets, what can we say?
Have another suggestion for interacting with your data? We'd love to hear about it.